

Multi-speciality clinic, Dubai · 1 April - 23 July 2026 · Google Ads
Two thousand patient enquiries at AED 11.60 each.
Four months of paid media for a Dubai multi-speciality clinic. Below are the account screenshots as reported, the full metric table, and what the clinic said about it.
- Impressions
- 640k Search, display and remarketing
- Conversions
- 2,001 Calls, forms and WhatsApp enquiries
- Blended CPA
- AED 11.60 From AED 16.47 in April to AED 9.10 in July
- Total spend
- AED 23.2k Average CPC AED 0.64
Every month, unedited, straight from the account.
Full-size Google Ads screenshots. Headline figures exactly as Google reports them - no re-drawn charts, no selected date ranges, nothing cropped out.
- Impressions
- 219k
- Conversions
- 427.53
- Avg. CPC
- AED 0.73
- Cost
- AED 7.04k
- CPA
- AED 16.47
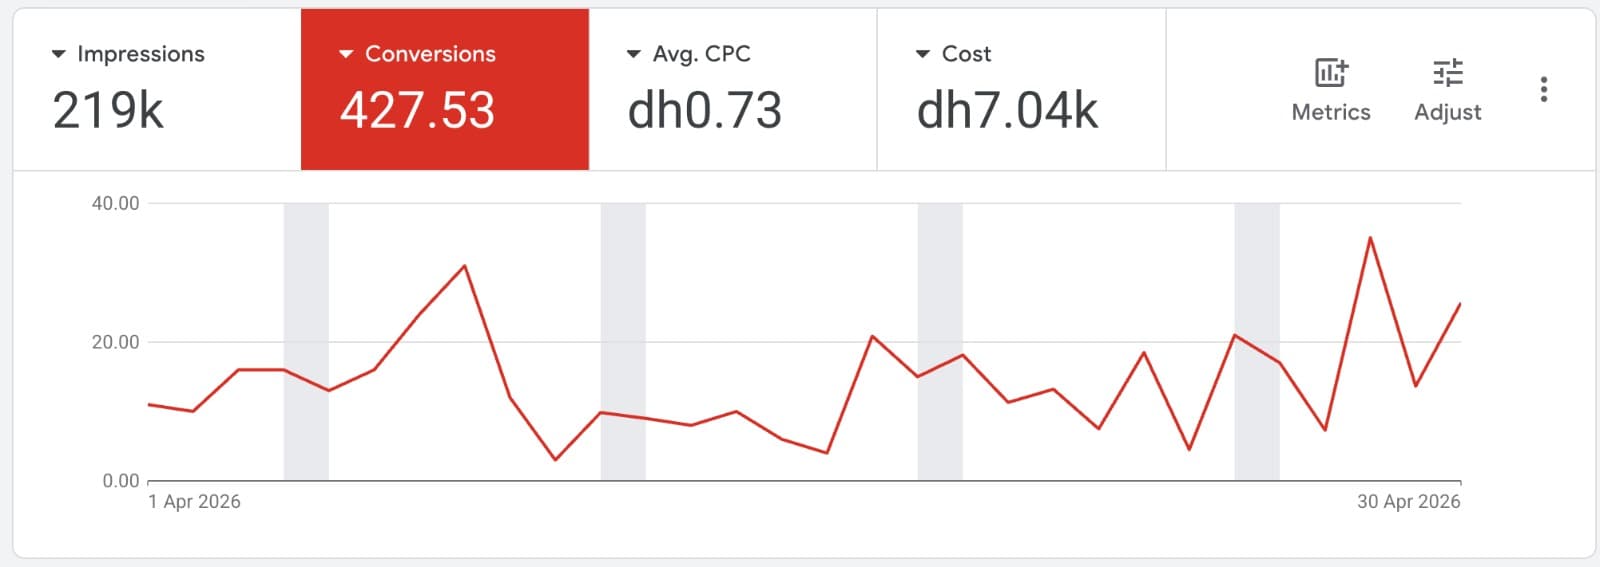
- Daily conversions
- - vertical axis 0.00 to 40.00. Peaks near 31 in week one and 35 in the final week; lowest day near 3. Grey bands mark weekends.
The starting position. Highest impression volume of the four months, and the highest cost per enquiry.
- Impressions
- 134k
- Conversions
- 697.92
- Avg. CPC
- AED 0.75
- Cost
- AED 6.61k
- CPA
- AED 9.47
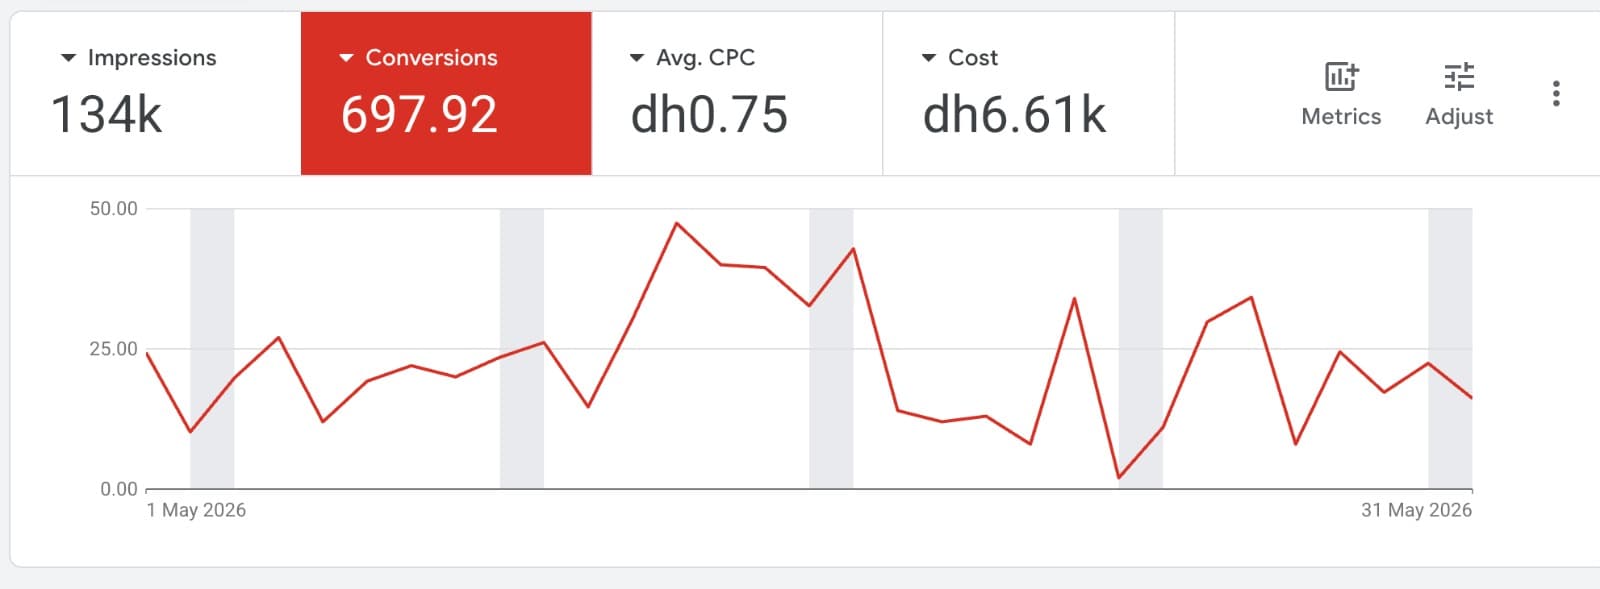
- Daily conversions
- - vertical axis 0.00 to 50.00. Highest day near 47 mid-month, several days above 35, one low near 1. Grey bands mark weekends.
Best month of the programme. Fewer impressions than April, 63% more enquiries, on slightly less budget.
- Impressions
- 130k
- Conversions
- 569.16
- Avg. CPC
- AED 0.73
- Cost
- AED 6.78k
- CPA
- AED 11.91
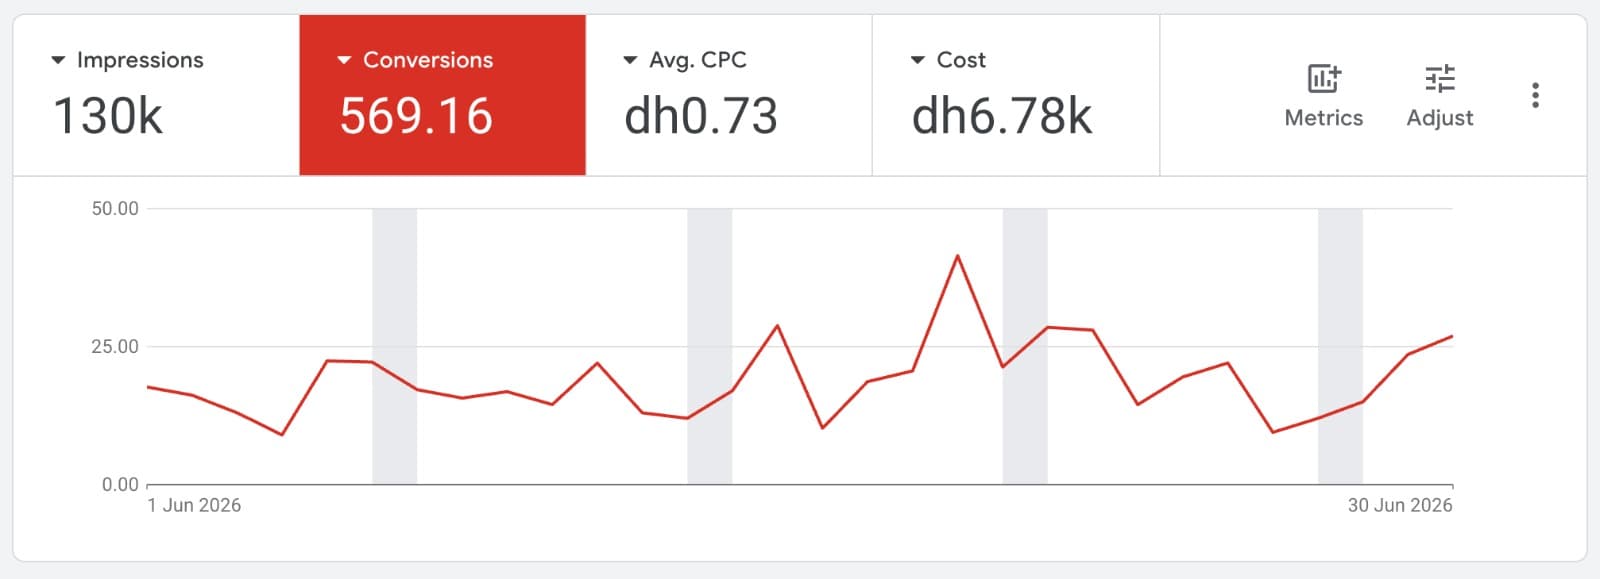
- Daily conversions
- - vertical axis 0.00 to 50.00. Single peak near 41 mid-month; most days between 12 and 28; lows near 9. Grey bands mark weekends.
Volume eased over the summer. Cost per enquiry rose but stayed a third below the April figure.
- Impressions
- 157k
- Conversions
- 306.48
- Avg. CPC
- AED 0.32
- Cost
- AED 2.79k
- CPA
- AED 9.10
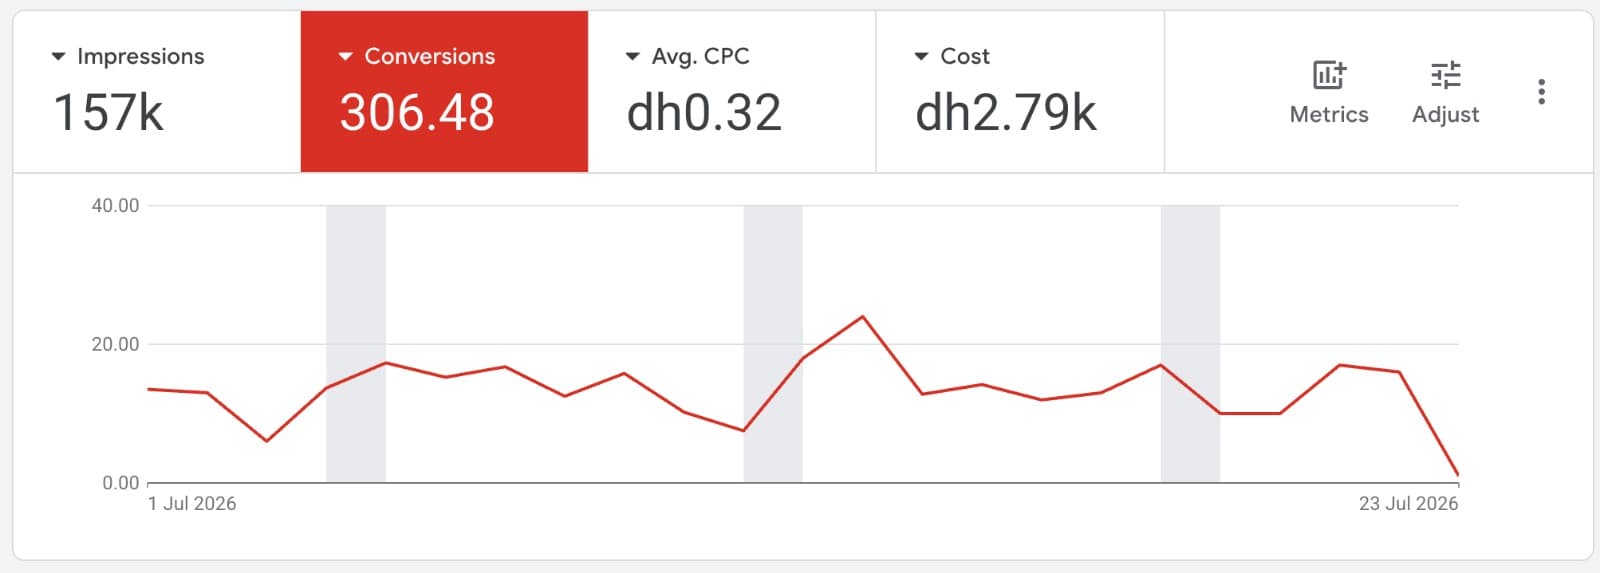
- Daily conversions
- - vertical axis 0.00 to 40.00. Steadiest month of the four: most days between 10 and 18, one peak near 24. The drop to near 1 at the right edge is 23 July, an incomplete day. Grey bands mark weekends.
Lowest cost per click and lowest cost per enquiry of the programme.
- Impressions
- 103k
- Conversions
- 205.00
- Avg. CPC
- AED 0.46
- Cost
- AED 2.41k
- CPA
- AED 11.76
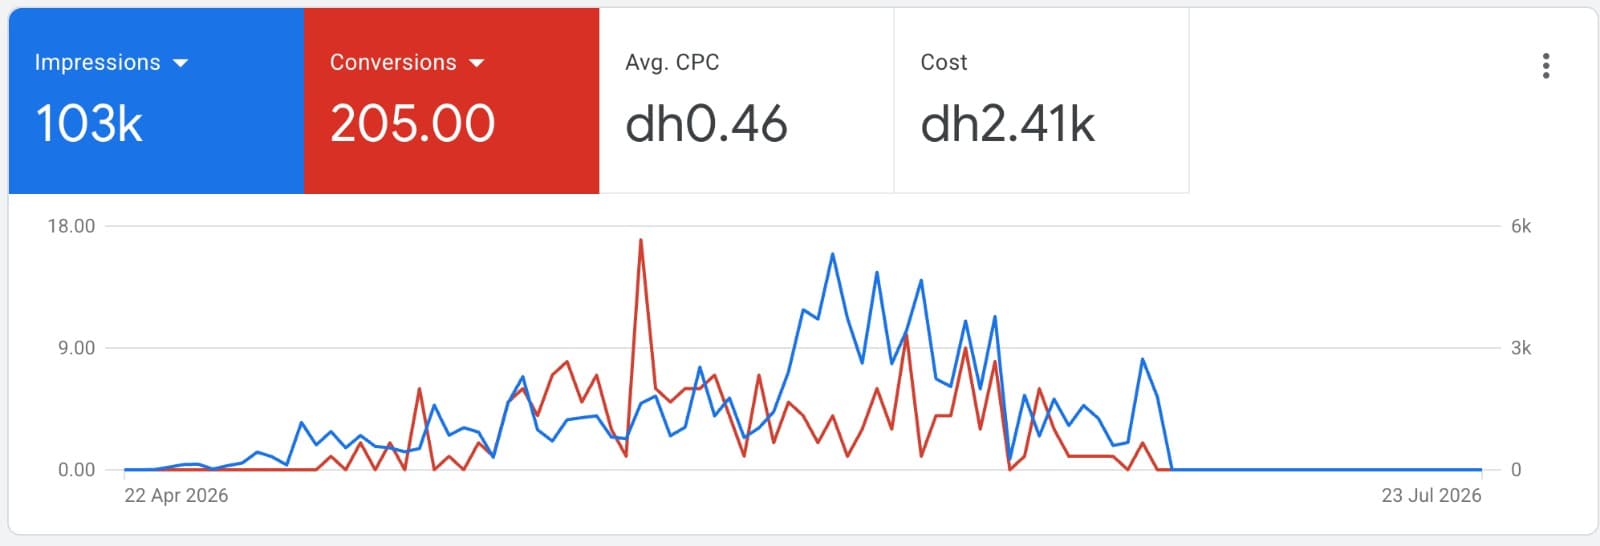
- Conversions
- - left axis, 0.00 to 18.00. Sharp single spike to 17 in late May; otherwise mostly between 2 and 9.
- Impressions
- - right axis, 0 to 6,000. Builds through May, peaks near 5,300 in mid June.
- The flat run to 23 July
- - both lines sit at zero from early July. This campaign stopped serving; the others continued, which is why the account total for July is unaffected.
One campaign pulled out of the account, with impressions laid over conversions. Its figures sit inside the monthly totals above rather than adding to them.
The same numbers, side by side.
Cost per enquiry fell 45% between the first month and the last. Spend did not increase to achieve it.
| Month | Impressions | Clicks | CTR | Conversions | CVR | Spend | CPC | CPA |
|---|---|---|---|---|---|---|---|---|
| April | 219,000 | 9,644 | 4.40% | 427.53 | 4.43% | 7,040 | 0.73 | 16.47 |
| May | 134,000 | 8,813 | 6.58% | 697.92 | 7.92% | 6,610 | 0.75 | 9.47 |
| June | 130,000 | 9,288 | 7.14% | 569.16 | 6.13% | 6,780 | 0.73 | 11.91 |
| July(to 23rd) | 157,000 | 8,719 | 5.55% | 306.48 | 3.52% | 2,790 | 0.32 | 9.10 |
| Total | 640,000 | 36,464 | 5.70% | 2,001.09 | 5.49% | 23,220 | 0.64 | 11.60 |
All currency in AED. Impressions, conversions, CPC and spend are as reported by Google Ads. Clicks, CTR and CVR are calculated from those figures. July covers 23 of 31 days.
What the terms mean
- Impressions
- How many times an ad appeared. A reach figure, not a performance one.
- Clicks
- How many people clicked through to the clinic's site or call button.
- CTRClick-through rate
- Clicks divided by impressions. Shows whether the ad reaches the right person.
- CPCCost per click
- Spend divided by clicks. What one visitor costs to bring in.
- Conversions
- Completed enquiries - calls, forms and WhatsApp messages that came from an ad.
- CVRConversion rate
- Conversions divided by clicks. Shows whether the traffic was worth having.
- CPACost per acquisition
- Spend divided by conversions. The cost of one patient enquiry - the number that matters most.
- Spend
- Media cost paid to Google over the period. Management fees are not included.
What the clinic said.
Symbiosis Medical Centre, Dubai - on the April to July programme.
They stopped reporting traffic to me and started reporting appointments. That single change told me they understood how a clinic actually works.
Cost per enquiry came down four months running, and nobody ever came to me asking for a bigger budget to make it happen.
See the same read on your own account.
We will look at your last 90 days of spend and show you where your appointments are actually coming from, before any engagement begins.
Figures from Google Ads, 1 Apr - 23 Jul 2026. Currency AED. Reported client results, published with the clinic's consent.